

Every month, a new headline claims housing is either booming or collapsing. Neither story is usually true. New home construction statistics rarely move in one clean direction as permits, starts, and completions each tell a slightly different piece of the story, and the real picture only emerges once you look at all three together.
That’s exactly what this guide sets out to do. It breaks down the latest Census and HUD numbers, explains why single-family and multifamily trends often diverge, and shows which states are actually building. You’ll also learn what these numbers mean if you’re planning a home in Washington State, where local conditions shape construction far more than any national average.
Key New Home Construction Statistics
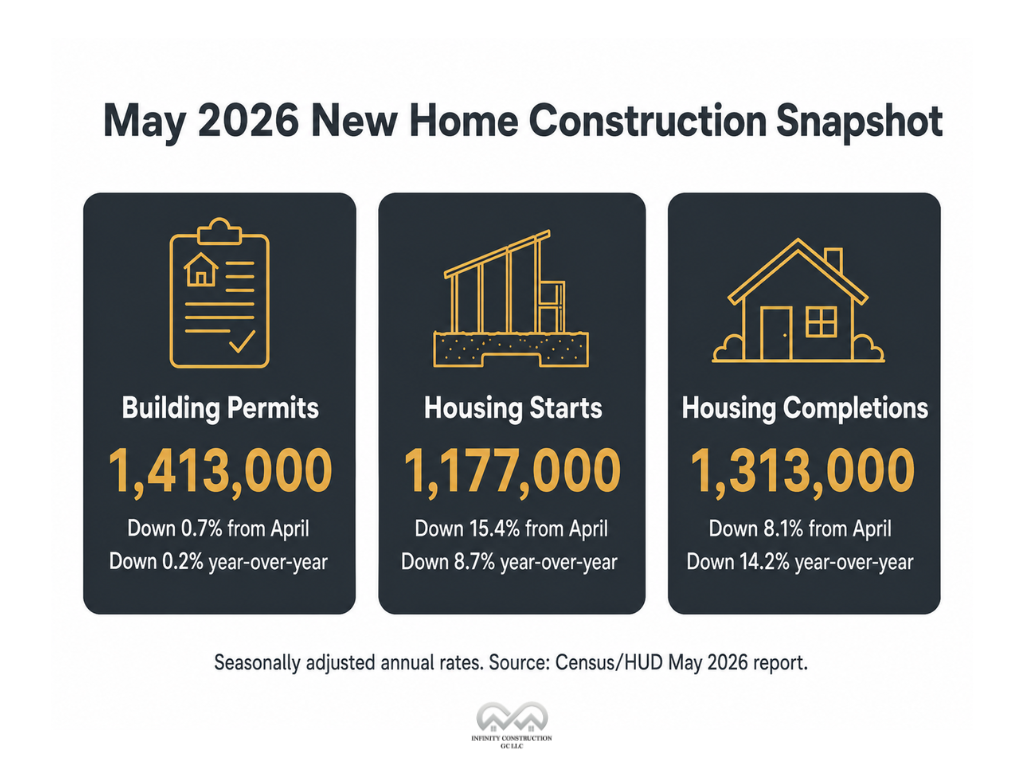
Before the deep dive, here’s the snapshot most readers come for. All figures are seasonally adjusted annual rates (SAAR) from the U.S. Census Bureau and HUD’s joint New Residential Construction report, released June 16, 2026:
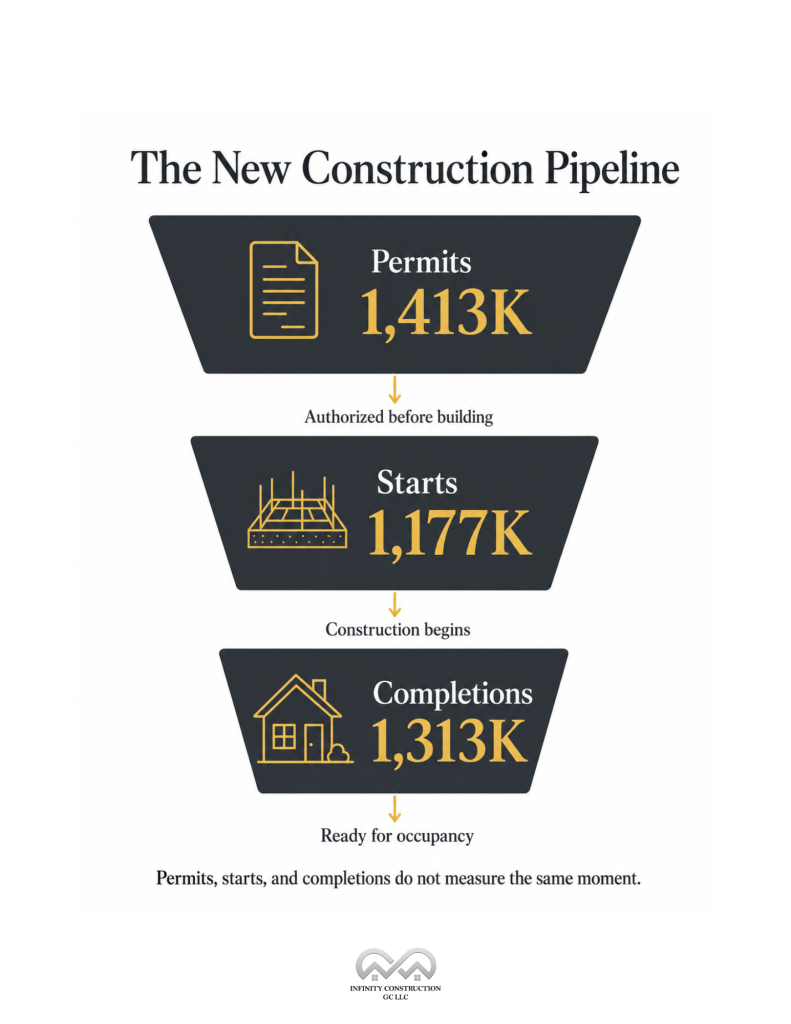
- Housing starts – 1,177,000 units — down 15.4% from April, down 8.7% year-over-year
- Building permits – 1,413,000 units; down 0.7% from April, down 0.2% year-over-year
- Housing completions – 1,313,000 units; down 8.1% from April, down 14.2% year-over-year
- Single-family starts – 882,000 units
- Multifamily starts (5+ units) – 284,000 units
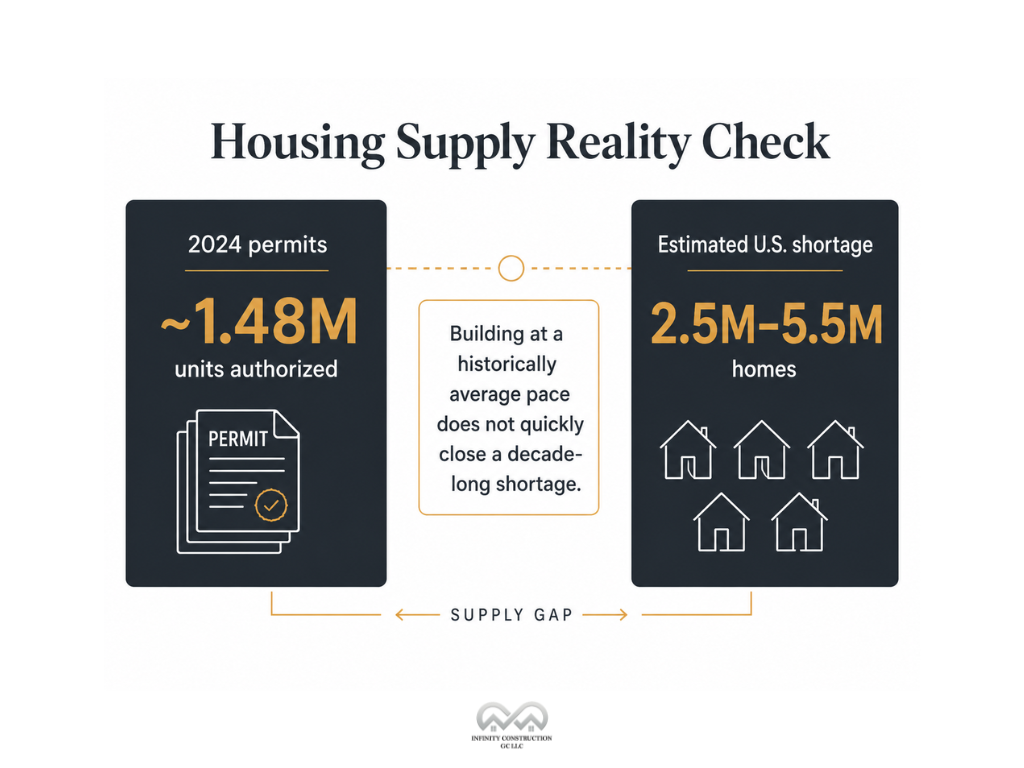
- Most recent full-year permits (2024) – ~1.48 million units
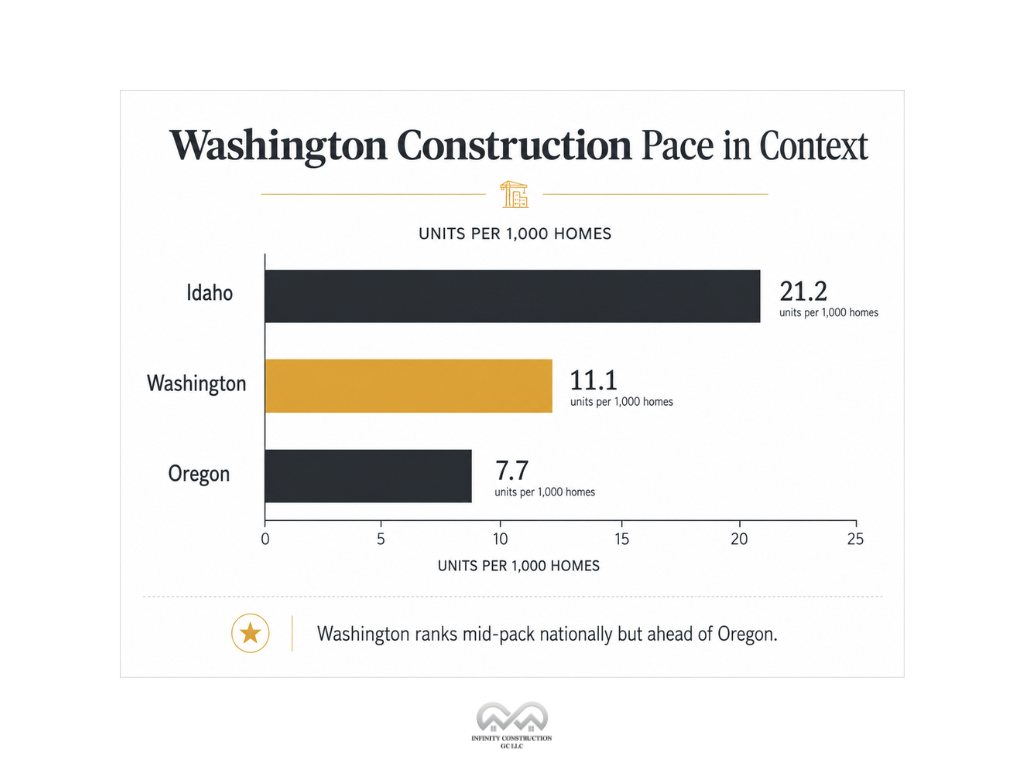
- Top state for new residential construction (per capita) – Idaho led the nation in 2024, authorizing 21.2 new housing units per 1,000 existing homes.
- Washington State – Authorized 11.1 units per 1,000 homes (15th nationally), outperforming neighboring Oregon, which authorized 7.7 units per 1,000 homes.
How Many New Homes Are Built Each Year?
In 2024, U.S. builders secured permits for approximately 1.48 million new housing units. While this slightly exceeded the long-term historical average of roughly 1.45 million annual permits, it remained insufficient to close the nation’s accumulated housing shortage.
Housing economists estimate the U.S. is short between 2.5 million and 5.5 million homes, largely due to more than a decade of underbuilding following the Great Recession. Census data show housing starts fell from a housing-boom peak of 2.27 million units (SAAR) to a low of roughly 478,000 units (SAAR) during the recession. As a result, building at today’s historically average pace helps meet current demand but is generally insufficient to eliminate the housing deficit created over the past 15 years.
Housing Starts vs. Building Permits vs. Completions
Nearly every housing statistics page on the internet uses these three terms interchangeably. They shouldn’t. Each one measures a different moment in a home’s life cycle, and each tells you something different about where the market is headed.
| Metric | What It Measures | Best Used For |
| Building permits | Homes authorized by a local permitting office, before any ground is broken | Forecasting future construction activity – a leading indicator |
| Housing starts | Construction has actually begun (excavation for footings or foundation) | Measuring current building activity in real time |
| Units under construction | Homes that have started but aren’t yet finished | Gauging builder workload and active inventory |
| Housing completions | Homes fully finished and ready for occupancy | Measuring new supply actually hitting the market |
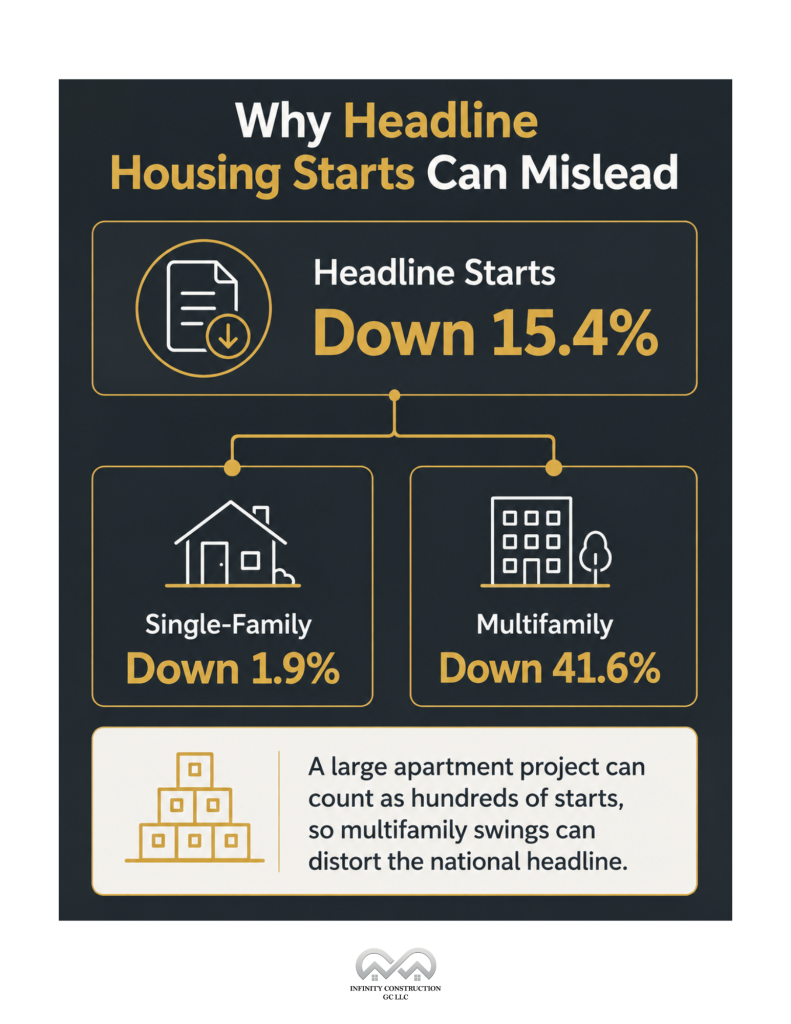
The critical distinction between housing permits and starts became clear in May 2026, when permits fell only 0.7% month-over-month while actual starts plummeted by 15.4%. Relying solely on permit data would falsely suggest steady builder activity, whereas looking only at starts would imply an industry in freefall.
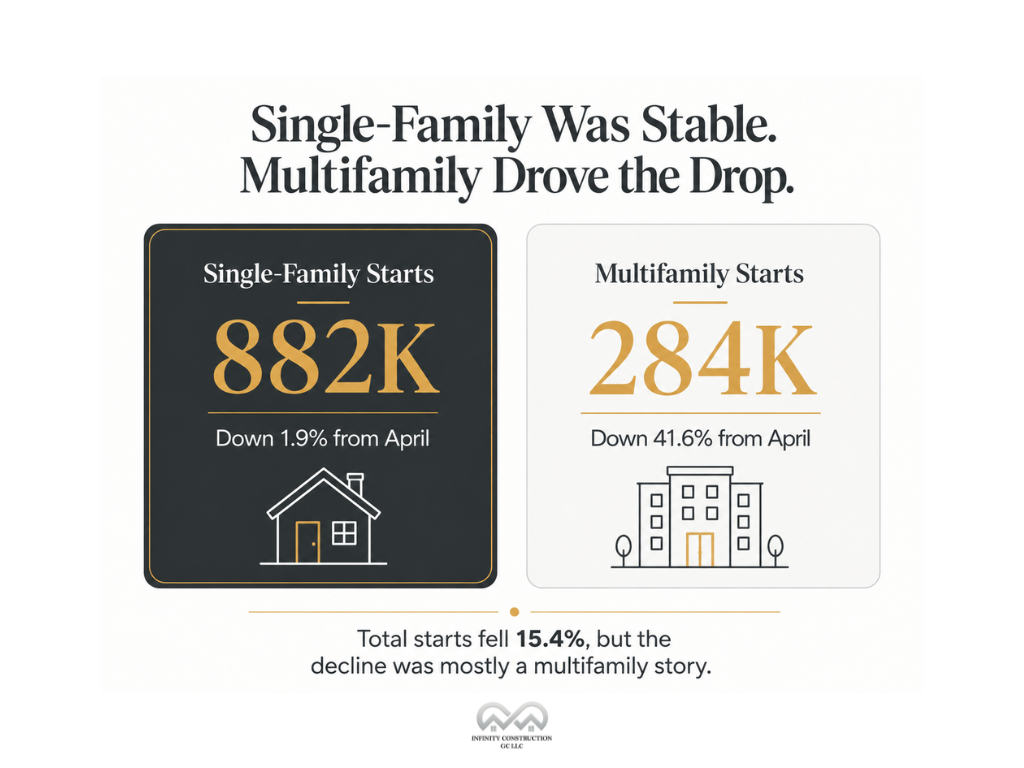
The reality behind the numbers is far more specific. Nearly the entire decline in starts occurred within the volatile multifamily sector, where buildings with five or more units dropped by 41.6%. Conversely, single-family starts, the metric most relevant to custom home demand, slipped just 1.9%, a minor shift that falls completely within the Census Bureau’s margin of error. This highlights the nuance that gets lost when media outlets report a single headline number without breaking it down.
Latest New Residential Construction Report – May 2026 in Detail
The Census Bureau and HUD jointly publish the New Residential Construction report each month, and it remains the single authoritative source for U.S. housing production data. Here’s what the most recent release CB26-102, covering May 2026 and published June 16, 2026 showed:
Building permits – 1,413,000 (SAAR)
- Down 0.7% from April’s revised rate of 1,423,000
- Down 0.2% from May 2025’s rate of 1,416,000
- Single-family permits – 886,000 (up 0.6% from April)
- Permits for buildings with 5+ units – 474,000
Housing starts – 1,177,000 (SAAR)
- Down 15.4% from April’s revised rate of 1,392,000
- Down 8.7% from May 2025’s rate of 1,289,000
- Single-family starts – 882,000 (down 1.9% from April, not statistically significant)
- Starts in buildings with 5+ units – 284,000 (down roughly 42% from April)
Housing completions – 1,313,000 (SAAR)
- Down 8.1% from April’s revised rate of 1,429,000
- Down 14.2% from May 2025’s rate of 1,530,000
- Single-family completions – 872,000 (down 1.6% from April)
- Completions in buildings with 5+ units – 426,000
Regionally, starts fell across three of the four Census regions, such as the South (-17.0%), the West (-17.2%), and the Northeast (-26.8%), while the Midwest was the only region to post a gain, up 3.7%.
New Residential Construction by State
National averages hide enormous regional variation. The most useful way to compare states isn’t total permits issued; it’s permits per 1,000 existing homes, which normalizes for the fact that Texas will always issue more permits than Rhode Island simply because it’s bigger.
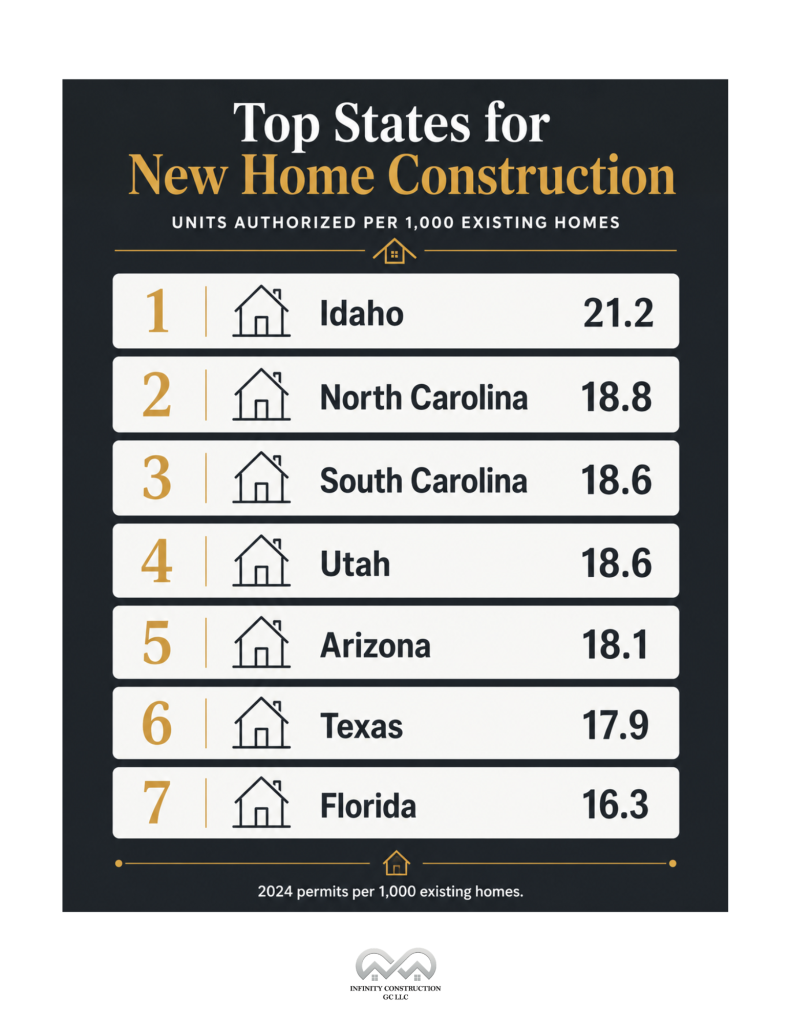
Top states for new home construction (2024, units per 1,000 existing homes)
| Rank | State | Units per 1,000 Homes | Total Units Authorized (2024) |
| 1 | Idaho | 21.2 | 17,630 |
| 2 | North Carolina | 18.8 | 95,163 |
| 3 | South Carolina | 18.6 | 47,072 |
| 4 | Utah | 18.6 | 23,902 |
| 5 | Arizona | 18.1 | 59,616 |
| 6 | Texas | 17.9 | 225,756 |
| 7 | Florida | 16.3 | 173,326 |
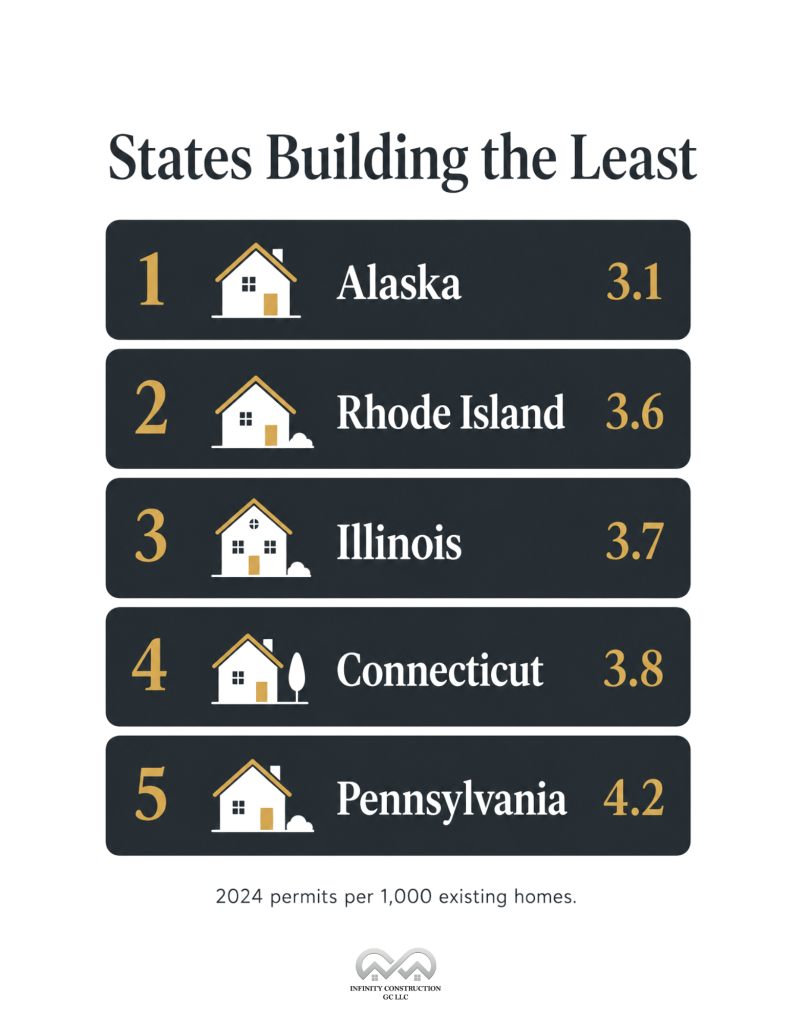
States building the least (2024)
| Rank | State | Units per 1,000 Homes |
| 1 | Alaska | 3.1 |
| 2 | Rhode Island | 3.6 |
| 3 | Illinois | 3.7 |
| 4 | Connecticut | 3.8 |
| 5 | Pennsylvania | 4.2 |
The fastest-building states cluster in the South and Mountain West due to greater land availability and flexible zoning, while the Northeast and Midwest lag because of tighter regulations and built-out land.
Counterintuitively, top-tier builders like Texas, Florida, and South Dakota saw permit volumes drop by 14.2%, 17.4%, and 36.1%, respectively, between 2022 and 2024. This shows that leading on a per-capita basis does not mean construction is accelerating; these states are simply cooling down from historic highs while still outpacing the nation.
Single-Family vs. Multifamily New Construction
Single-family and multifamily construction reflect different market forces, making the headline housing starts figure less useful for custom home builders. Because each apartment unit counts as a separate housing start, large multifamily projects can significantly distort the national total.
One 200-unit apartment building, for example, adds 200 housing starts when construction begins. As a result, a few large projects starting or being delayed can drive sharp monthly swings in total housing starts, even if single-family construction changes very little.
The May 2026 report illustrates this clearly. Total housing starts fell 15.4%, but single-family starts declined just 1.9%, while multifamily starts (5+ units) dropped 41.6% to 284,000. The decline was driven primarily by multifamily construction rather than weakening demand for single-family homes.
| Category | April 2026 (Revised) | May 2026 | % Change |
| Total housing starts | 1,392,000 | 1,177,000 | −15.4% |
| Single-family starts | 899,000 | 882,000 | −1.9% |
| Buildings with 5+ units (starts) | 486,000 | 284,000 | −41.6% |
How Long Does New Home Construction Take?
Single-family home construction times are extending beyond the typical four to six months, with increased delays between permitting and groundbreaking. These lengthened timelines impact all phases of development, from initial authorization to completion.
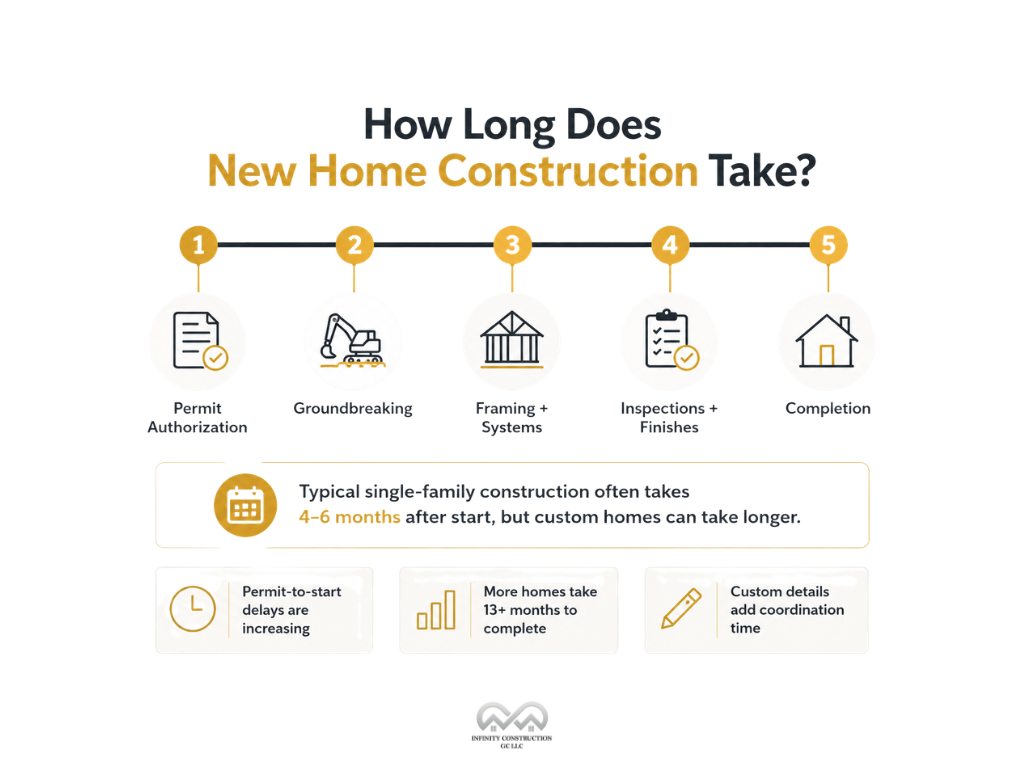
For custom home builds specifically, several additional variables stretch timelines well beyond the national average:
- Permitting complexity – Local review cycles, variances, and inspections
- Site preparation – Grading, utility hookups, soil conditions
- Weather windows – Especially relevant in rainier climates like the Pacific Northwest
- Labor availability – Skilled trade shortages remain a persistent bottleneck nationally
- Material lead times – Custom finishes and specialty materials often carry longer order windows than production-home materials
- Design complexity – Custom floor plans require more coordination between architects, engineers, and trades than repeatable production layouts
What New Construction Data Means for Washington State
National housing headlines rarely translate cleanly to any single state, and Washington is a prime example of why local context matters. In 2024, as mentioned above, Washington authorized 11.1 new housing units per 1,000 existing homes. This pace puts the state ahead of neighboring Oregon (7.7) but behind faster-building states like Idaho and Utah.
Local permitting and regulatory hurdles
Washington’s construction mix skews differently from the fast-growing Sun Belt markets that dominate national rankings. Permitting complexity in dense metro areas like Seattle-Tacoma-Bellevue adds significant time to the pre-construction phase, as builders must navigate multiple layers of local municipal review. Furthermore, the state enforces some of the strictest energy code requirements in the country, which adds design considerations and structural inspection steps that most other states don’t require.
Climate and geographic constraints
Beyond regulatory hurdles, the Pacific Northwest environment directly impacts physical build schedules. Rain and moisture management require specialized building envelope designs, strict weather-protection protocols, and careful scheduling around wet-weather windows. Additionally, site preparation is constrained by the unique topography of the Puget Sound region, where limited lot availability and challenging terrain make straightforward development difficult.
The impact on project timelines
A permit in Washington doesn’t mean a home is simple to build. State statistics reflect greater planning and inspection rigor than in similarly sized homes in states like Texas or Florida. Because national statistics mask these local climate, code, and permitting realities, partnering with an experienced builder is critical to keeping projects on schedule.
New Home Construction Trends to Watch
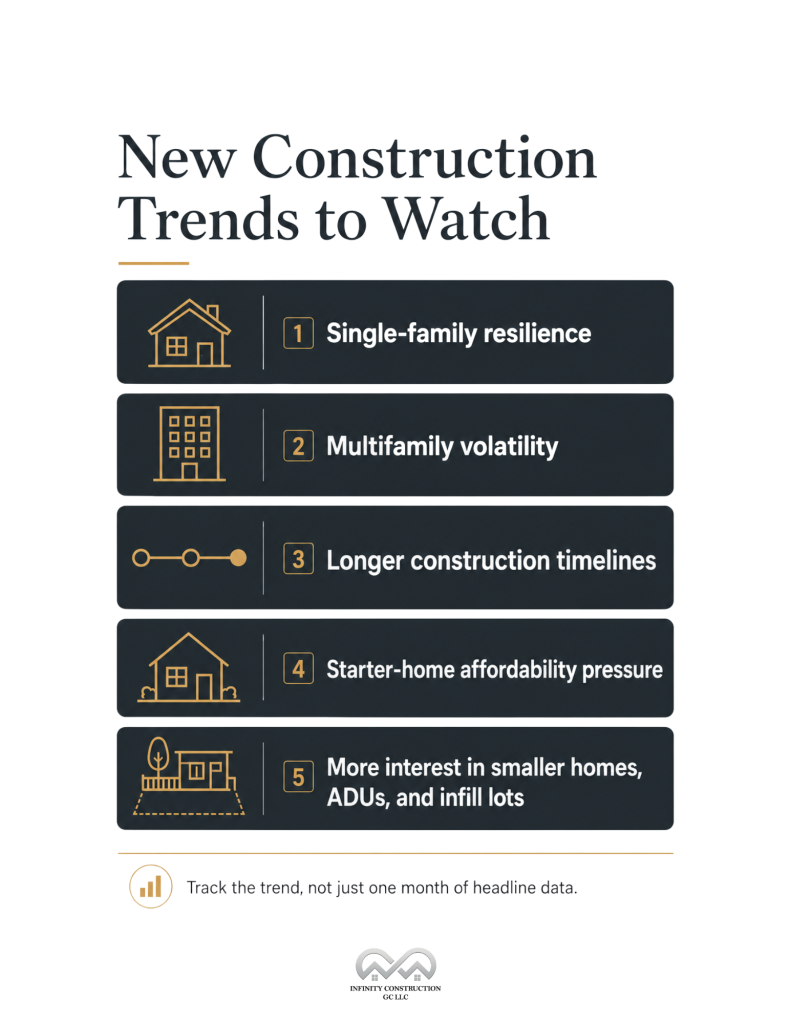
Based on recent data from the U.S. Census Bureau, NAHB, and independent housing analysts, several trends are shaping the housing market through the rest of 2026:
- Single-family resilience amid multifamily volatility – Single-family construction remains relatively stable, while multifamily activity continues to fluctuate with interest rates and rental demand.
- Regional migration reshaping demand – Fast-growing markets like Raleigh, Austin, and Charlotte are seeing slower home price growth than supply-constrained metros such as San Francisco and Seattle.
- Longer construction timelines – Labor shortages, permitting delays, and material lead times continue to extend build schedules.
- Affordability pressures limiting starter homes – Rising construction costs are making entry-level homes the most difficult segment to build.
- Growing demand for smaller homes and ADUs – Buyers and builders are increasingly turning to smaller homes, ADUs, and infill development to offset high land costs and zoning restrictions.
- Zoning reform gaining momentum – AEI Housing Center estimates that restoring “light-touch density” (2-4-unit housing) to 1950s levels could add up to 12.5 million housing units over time.
Conclusion
At the end of the day, new home construction statistics only tell a useful story when you read them in context. A single month’s headline number can mislead just as easily as it can inform, especially when multifamily volatility masks what’s actually happening with single-family demand. Permits, starts, and completions each capture a different moment in that process, and understanding how they connect gives you a far clearer read than any one figure alone.
Whether you’re tracking national trends or figuring out what they mean for a build in Washington State, the details matter more than the headlines. By understanding how these numbers move together, you’re better equipped to separate real shifts from short-term noise. And when you’re ready to turn that data into an actual home, having a builder who understands both the market and the ground you’re building on makes all the difference.